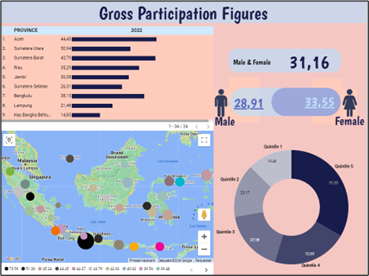
Data Visualization of Higher Education Participation Rates in Indonesia Provinces
DOI:
https://doi.org/10.70103/galaksi.v1i2.20Keywords:
Data Visualization, Demographics Time Series Data, Higher Education Enrollment RateAbstract
The objective of this study is to analyze the disparity in higher education enrollment in Indonesia using data visualization produced by the Exploratory Data Analysis (EDA) technique. This graphic specifically examines the Gross Participation Rate of higher education among provinces, expenditure quintiles, and genders for the period of 2019 to 2023. The data was gathered from Statistics Indonesia and presented using Google Data Studio to offer a clearer and more comprehensible representation of the disparity. The findings indicate notable variations in Gross Participation Rate across provinces, with DI Yogyakarta continuously exhibiting the highest Gross Participation Rate and Bangka Belitung Islands displaying the lowest Gross Participation Rate over the duration of the study. Furthermore, Gross Participation Rate exhibits greater values within the quintile 5, which represents the group with the highest expenditure. Additionally, Gross Enrollment Rate is also higher in females when compared to males. The resulting visualization can serve as a potent instrument for policy makers to comprehend and tackle disparities in access to higher education in Indonesia.


